
Interactive plot with ggplot2 and ggiraph
Keon-Woong Moon
May 24, 2016
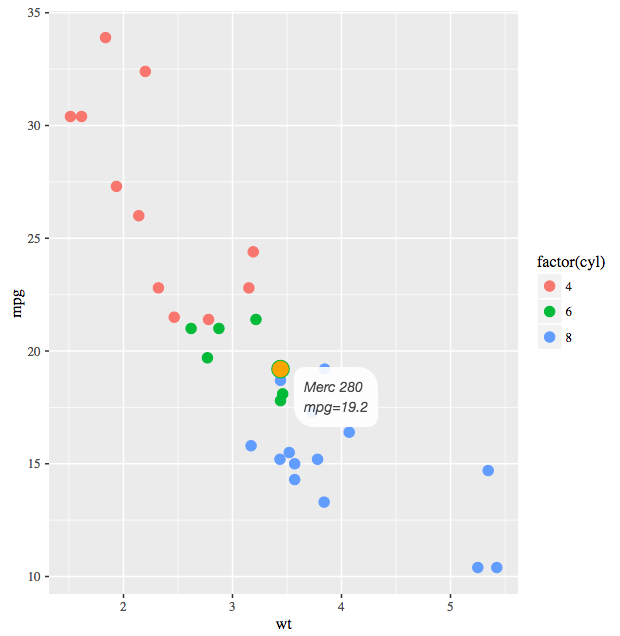
웹상에서 interactive plot을 구현할 때 D3.js 등을 쓰거나 plotly등을 쓸수 있다. R에서는 plotly, rbokeh 또는 googleVis 등을 쓰면 interactive plot을 구현할 수 있는데 최근 나온 ggiraph 패키지는 htmlwidgets을 이용하여 ggplot2로 만든 plot을 interactive plot으로 바꾸어준다. ggplot2의 모든 기능이 가능한 것은 아니고 geom_point, geom_polygon, geom_map, geom_path, geom_rect, geom_text, geom_segment등이 가능하다. 다음 그림은 geom_point를 geom_point_interactive로 바꾸어 interactive plot을 구현한 예이다. 커서를 점 위로 올리면 interaction을 볼 수 있다.
http://rpubs.com/cardiomoon/183633
- Total
- 의학논문 작성을 위한 R통계와 그래프
- R을 이용한 조건부과정분석
- 웹에서 클릭만으로 하는 R통계분석
- Learn ggplot2 Using Shiny App
- 일반화가법모형 소개
- 밑바닥부터 시작하는 ROC 커브 분석
- 웹R을 이용한 통계분석
- 의료인을 위한 R 생존분석
| No. | Subject | Author | Date |
|---|---|---|---|
| 33 | 2판 출판 예정일 문의 [2] | pslee | 2024.01.23 |
| 32 | 2판 혹시 언제쯤 출간 예정일지요? [1] | 니콜라오 | 2023.10.13 |
| 31 | 2판 [1] | rlagurrn | 2023.01.27 |
| 30 | mytable 문의 [2] | 떠도는고라니 | 2022.12.20 |
| 29 | R을 이용한 조건부과정분석 문의드려요. | sophiachoi | 2022.03.05 |
| 28 | 제2판 출간소식을 기다립니다.. [1] | swpapa | 2021.04.05 |
| 27 | 책 구매 하려고 하는데 품절이 되서 구매할수 있는지 궁금합니다. [1] | 기드온 | 2020.07.30 |
| 26 |
메타분석 강의록
| cardiomoon | 2020.05.31 |
| 25 |
설문조사데이터
| cardiomoon | 2020.05.08 |
| 24 |
데이터 전처리 예제
| cardiomoon | 2020.05.08 |
| 23 | 일반화가법모형에 관하여 정리를 해보았습니다 | cardiomoon | 2020.04.02 |
| 22 | 혹시 책을 이제는 더이상 살수 없나요? [2] | yosep.chong | 2019.07.15 |
| 21 | mytable과 mycph에서 [1] | 라시드 | 2018.12.14 |
| 20 | mytable 이용시 error in data.frame [3] | 우각차단 | 2017.07.18 |
| 19 |
설문조사 데이터 (성빈센트병원)
[2] | cardiomoon | 2017.04.20 |
| 18 | p147 require(xlsx) 안됩니다 [1] | KCRS_LeeJM | 2017.03.16 |
| 17 | moonbook package 설치에 문제가 있는 건가요? [2] | KCRS_LeeJM | 2017.03.14 |
| 16 |
해결되지 않는 레이텍, ztable, moonbook2에 대해 질문 드립니다.
[1] | neurojang | 2017.01.04 |
| 15 | 오자 [1] | 서울성모부정맥 | 2016.07.06 |
| » |
Interactive plot with ggplot2 and ggiraph
[1] | cardiomoon | 2016.05.25 |
간단한 코드의 삽입으로 자료 탐색에 큰 도움이 되겠네요. 좋은 글 감사합니다.